Franz Ackermann, an artist, sketches representations of what he sees on the ground level, the streets. He recreates a representation of the world being interconnected to each other. Using contemporary art to depict financial markets, information and transportation networks, social relationships, and so on.
Sunday, December 7, 2008
Planimetric Map
Topographic Map
Thematic Map
A thematic map displays spatial pattern of a theme of attributes. This map shows USDA plant hardiness zone. There are different types of thematic maps, this map specifically is a dasymetric map of climate and plant hardiness defined with a key of different colors. John Snow was a thematic cartographer (cholera map 1855).
Cadasral Map
This is a comprehensive register of the metes and bounds of real property of a county. It is used to detail ownership. Cadastral Map overlaid on false colour composite of UMA Gani watershed, Chmur Taluk, Chandrapur District. This is using IRS_IC data on a scale of 1:4,000 to 1:8,000. Landsat and Spot satellites helped retrieve this image and data; its objective is land use.
PLSS
This is a public land survey system using cadastral information to depict Minnesota's PLSS base map. This is a small part of 1:100,000 scale of Worthington quadrangle. Each small box shows a quarter quarter section. Each number represents each quarter section quadrant and quarter quarter section quadrant. Townships and ranges are shown along with corresponding numbers.
Hypsometric Map
Prapaganda Map
Choropleth Map
Isoline Map
Flow Map
Cartogram
Statistical Map
Lidar
Isopach
Isopleth
DLG
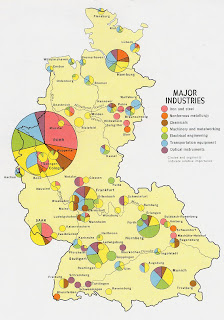
Continuously Variable Proportional Circle Map
Bivariate Choropleth Map
Univariate Choropleth Map
Index Value Plot
Scatterplot
Windrose
Star Plot
Standardized Choropleth Map
Unstandardized Choropleth Map
Bilateral Graph
Accumulative Line Graph of Lorenz Curve
Parallel Coordinate Graph
Histogram
Box Plot
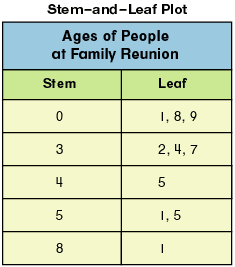
Stem and Leaf Plot
Subscribe to:
Posts (Atom)